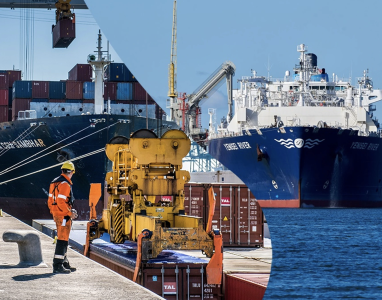
Antwerp has been a business hotspot for over five centuries. The result of this never-ending cycle of investment and growth is a mature business network, where partnerships and production chains are easy to form.
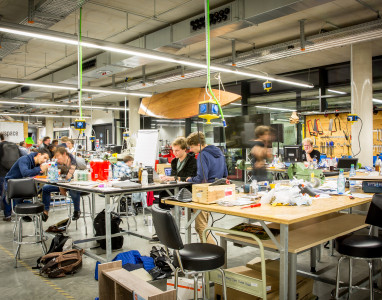
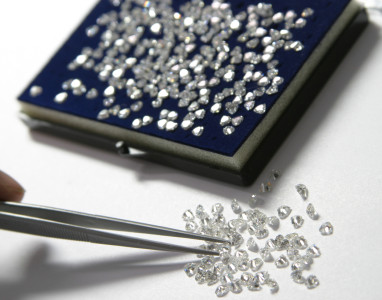
This is most clear in the chemicals industry, with Antwerp being the largest cluster in the world for all things chemistry and refinery. But the same goes for our start-up network, with everything from coworking office spaces to business angels networks and a growth-hacking mentality. Diamonds, fashion, retail, logistics, business services, … you’ll find a network tailored to your needs here. Ready for you to take advantage of.
So what are you waiting for?
Entrepreneurship
Belgium
Belgium shows a steady net growth in number of companies, with the exception of 2018 where the figures show a decline. In 2019, the net growth of business entities recovered and peaks with a growth rate of 4.70%.
Table: Net growth of the number of companies (%)
|
2015 |
2016 |
2017 |
2018 |
2019 |
|
|
Belgium |
1,22 |
2,69 |
2,06 |
-0,79 |
4,70 |
|
Germany |
-0,81 |
0,18 |
0,03 |
-3,86 |
1,46 |
|
France |
2,27 |
1,91 |
5,38 |
6,17 |
6,81 |
|
Luxembourg |
2,11 |
1,52 |
3,71 |
5,95 |
2,63 |
|
The Netherlands |
3,45 |
3,83 |
2,20 |
5,39 |
5,73 |
Source: Eurostat, 2019
Antwerp
In general, Antwerp shows a steady increase in total number of business entities from 2017 to 2021. In addition, the amount of newly starting businesses in Antwerp is growing over the past 5 years, confirming Antwerp is an exciting and interesting city to start a business.
|
2017 |
2018 |
2019 |
2020 |
2021 |
|
|
Total business entities |
96 000 |
94 699 |
97 792 |
98 600 |
101 666 |
|
New business entities |
-0,81 |
0,18 |
0,03 |
-3,86 |
1,46 |
Source: Stad in Cijfers
Belgium has the highest survival rate after 3 years compared to its neighboring countries. In 2019, 76.32% of companies have survived 3 years after their startup.
Table: Survival rate of newly established companies after 3 years
|
2014 |
2015 |
2016 |
2017 |
2018 |
2019 | |
|
Belgium |
75,43 |
71,20 |
69,99 |
72,51 |
73,14 |
76,32 |
|
Germany |
52,19 |
49,96 |
49,16 |
52,14 |
50,67 |
50,83 |
|
France |
59,16 |
59,95 |
60,71 |
59,67 |
62,33 |
63,57 |
|
Luxembourg |
68,41 |
67,92 |
68,36 |
67,55 |
69,32 |
68,73 |
|
The Netherlands |
65,25 |
66,84 |
71,29 |
71,37 |
74,33 |
75,12 |
Source: Eurostat, 2019
Belgium also shows the most stable and highest survival ratio after 5 years. In 2019, 62.39% of companies have survived 5 years after their startup.
|
2014 |
2015 |
2016 |
2017 |
2018 |
2019 | |
|
Belgium |
61,84 |
63,00 |
64,41 |
59,85 |
57,51 |
62,39 |
|
Germany |
38,95 |
38,31 |
38,63 |
38,97 |
36,51 |
38,54 |
|
France |
43,74 |
44,22 |
48,18 |
49,05 |
50,11 |
48,80 |
|
Luxembourg |
54,04 |
54,43 |
53,60 |
54,82 |
55,80 |
55,04 |
|
The Netherlands |
51,53 |
51,95 |
53,92 |
53,32 |
57,65 |
59,47 |
Source: Eurostat, 2019


