Belgium
Belgium shows a steady net growth in number of companies, with the exception of 2018 where the figures show a decline. In 2019, the net growth of business entities recovered and peaks with a growth rate of 4.70%.
Table: Net growth of the number of companies (%)
|
2015 |
2016 |
2017 |
2018 |
2019 |
|
|
Belgium |
1,22 |
2,69 |
2,06 |
-0,79 |
4,70 |
|
Germany |
-0,81 |
0,18 |
0,03 |
-3,86 |
1,46 |
|
France |
2,27 |
1,91 |
5,38 |
6,17 |
6,81 |
|
Luxembourg |
2,11 |
1,52 |
3,71 |
5,95 |
2,63 |
|
The Netherlands |
3,45 |
3,83 |
2,20 |
5,39 |
5,73 |
Source: Eurostat, 2019
Antwerp
In general, Antwerp shows a steady increase in total number of business entities from 2017 to 2021. In addition, the amount of newly starting businesses in Antwerp is growing over the past 5 years, confirming Antwerp is an exciting and interesting city to start a business.
|
2017 |
2018 |
2019 |
2020 |
2021 |
|
|
Total business entities |
96 000 |
94 699 |
97 792 |
98 600 |
101 666 |
|
New business entities |
-0,81 |
0,18 |
0,03 |
-3,86 |
1,46 |
Source: Stad in Cijfers
Belgium has the highest survival rate after 3 years compared to its neighboring countries. In 2019, 76.32% of companies have survived 3 years after their startup.
Table: Survival rate of newly established companies after 3 years
|
2014 |
2015 |
2016 |
2017 |
2018 |
2019 | |
|
Belgium |
75,43 |
71,20 |
69,99 |
72,51 |
73,14 |
76,32 |
|
Germany |
52,19 |
49,96 |
49,16 |
52,14 |
50,67 |
50,83 |
|
France |
59,16 |
59,95 |
60,71 |
59,67 |
62,33 |
63,57 |
|
Luxembourg |
68,41 |
67,92 |
68,36 |
67,55 |
69,32 |
68,73 |
|
The Netherlands |
65,25 |
66,84 |
71,29 |
71,37 |
74,33 |
75,12 |
Source: Eurostat, 2019
Belgium also shows the most stable and highest survival ratio after 5 years. In 2019, 62.39% of companies have survived 5 years after their startup.
|
2014 |
2015 |
2016 |
2017 |
2018 |
2019 | |
|
Belgium |
61,84 |
63,00 |
64,41 |
59,85 |
57,51 |
62,39 |
|
Germany |
38,95 |
38,31 |
38,63 |
38,97 |
36,51 |
38,54 |
|
France |
43,74 |
44,22 |
48,18 |
49,05 |
50,11 |
48,80 |
|
Luxembourg |
54,04 |
54,43 |
53,60 |
54,82 |
55,80 |
55,04 |
|
The Netherlands |
51,53 |
51,95 |
53,92 |
53,32 |
57,65 |
59,47 |
Source: Eurostat, 2019
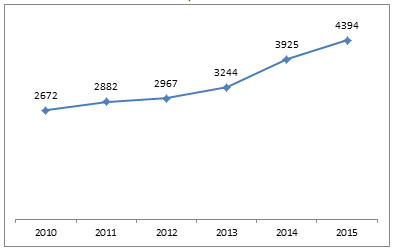
The number of starters is growing steadily in Antwerp