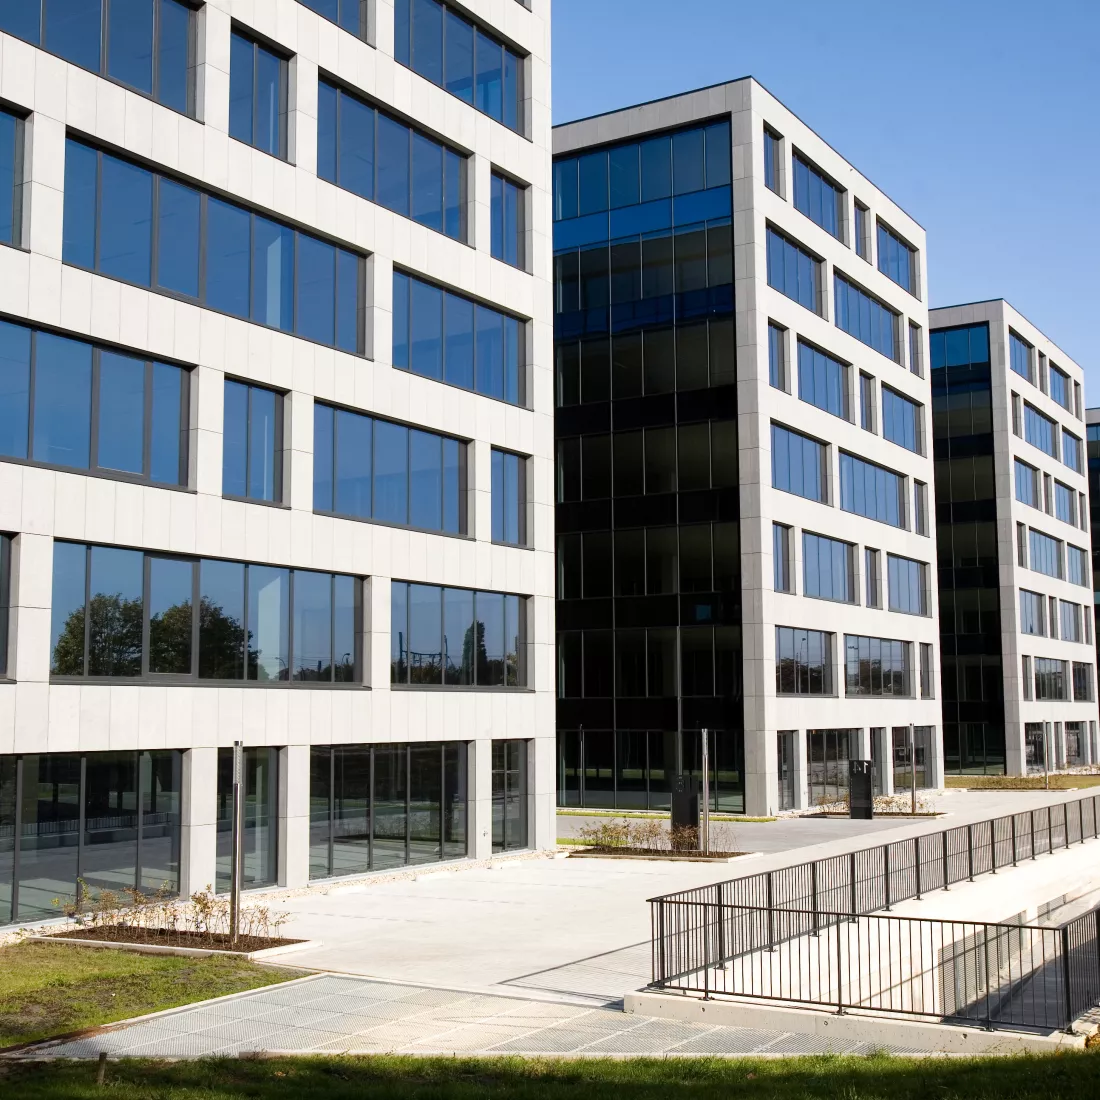
In a few months, Blue Gate Antwerp will welcome its first occupants. The brand new, eco-effective and water-bound redeveloped brownfield is exemplary for the ambitions of the city in catering for modern industries. Here, sustainable production facilities and state-of-the-art R&D departments will find their natural home.
The recent growth of Antwerp has also created an immense array of available office spaces, ranging from old industrial buildings to new developments, both in the heart of the city or at its outer borders.

There are 2.2 million m2 of office space in the City of Antwerp, and so there are plenty of offices. The upper rental limits in the centre is 160 euros/m²/year.
Office space is cheaper in Antwerp than that of comparable quality in the major commercial centres in neighbouring countries.
Office rental prices
Office rental prices
| City | Prime Rents |
|---|---|
| London (West End) GBP/sq.m/yr | 1097 |
| London (City) GBP/sq.m/yr | 700 |
| Paris (CBD) €/sq.m/yr | 900 |
| Paris (La Défense) €/sq.m/yr | 525 |
| Frankfurt (CBD) €/sq.m/yr | 540 |
| Munich (CBD) €/sq.m/yr | 474 |
| Amsterdam (South Axis) €/sq.m/yr | 450 |
| Dusseldorf (CBD) €/sq.m/yr | 342 |
| Brussels (EU Leopold) €/sq.m/yr | 320 |
| Lyon €/sq.m/yr | 305 |
| Marseille €/sq.m/yr | 260 |
| The Hague €/sq.m/yr | 230 |
| Hamburg (CBD) €/sq.m/yr | 360 |
| Rotterdam €/sq.m/yr | 235 |
| Antwerp €/sq.m/yr | 165 |
Source: The DNA of Real Estate Europe, Fourth Quarter 2020, Cushman & Wakefield
There are 760 hectares of land in the City of Antwerp that are developed or have development potential for industry and logistics. Over 56 hectares of that is unused and unallocated. The upper rental limit for industry is 57 euros/m²/year, while for logistics the upper rental limit stands at 48 euros/m²/year.
| Parameter | Value |
|---|---|
| Total surface area | 752.22 ha |
| Unused unspend | 56.80 ha |
| Prime rent industry | 43-48 EUR / m² / year |
| Prime rent logistics | 46 EUR / m² / year |
Source: Arcadis and Jones Lang Lasalle, 2014
Prime rents for retail
| City | Occupancy cost |
|---|---|
| London (West End) | 16 146 |
| Paris | 13 255 |
| Berlin | 3780 |
| Munich | 4 440 |
| Frankfurt | 3 780 |
| Hamburg | 3 720 |
| Cologne | 3 540 |
| Dusseldorf | 3 420 |
| Amsterdam | 3 000 |
| Glasgow | 2 607 |
| Antwerp | 1 950 |
| Brussels | 1 850 |
| Lyon | 1841 |
| Edinburgh | 1 808 |
| Manchester | 1 747 |
| Rotterdam | 1 600 |
| Maastricht | 1 600 |
| Lille | 1 326 |
| The Hague | 1 250 |
Source: Cushman & Wakefield, Retail snapshot Q3 2017 (11/2017)
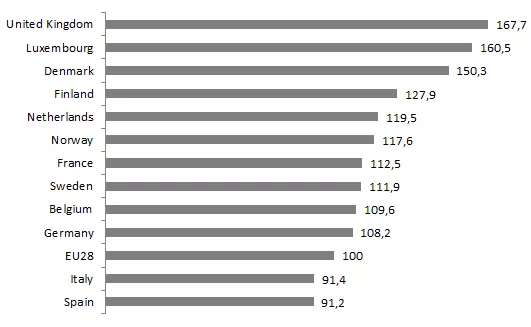
Cost of living in Antwerp
The cost of living in Belgium is lower than that of its neighbouring countries. The cost contains the average rent for housing as well as the cost for water, electricity and gas. The price comparison is shown with the average cost for the EU at 100. (source: Eurostat 2018)


